In this post I describe a couple of tools I used to find a performance issue in an Erlang software called Disco. Disco is a map-reduce framework written in Erlang and Python. The core of the framework is written in Erlang which exposes an http api which can be used by any client. The main client however, is written is Python.
We at Chango had a performance issue when we store too many files in the Disco Distributed File System (DDFS). DDFS is a tag based file system where each blob of data is known by its tag. A large number of files can be stored in DDFS and it takes care of the replication and fault tolerance so that if a limited number of nodes fail, the cluster can continue without interruption. The disco map-reduce jobs can then run on top of these tags and use them as inputs or outputs of different stages of map-reduce. Currently disco has a single namespace for all of the tags and has no concept of permission or other POSIX-like filesystems. However, it supports the concept of hierarchy where a tag can reference another tag.
The performance issue with the large number of tags was that the Disco master becomes unstable and we see a lot of timeouts in different functions; crippling the master and eventually resulting in the server crash. Right now, we have mitigated this issue by increasing the timeouts of the gen_server calls to infinity for the critical calls so that under pressure the less important calls time out but the more important ones take as much time as they need to. In this post I talk about the different tools that I used for investigating this issue and the applicability and usability of each of them.
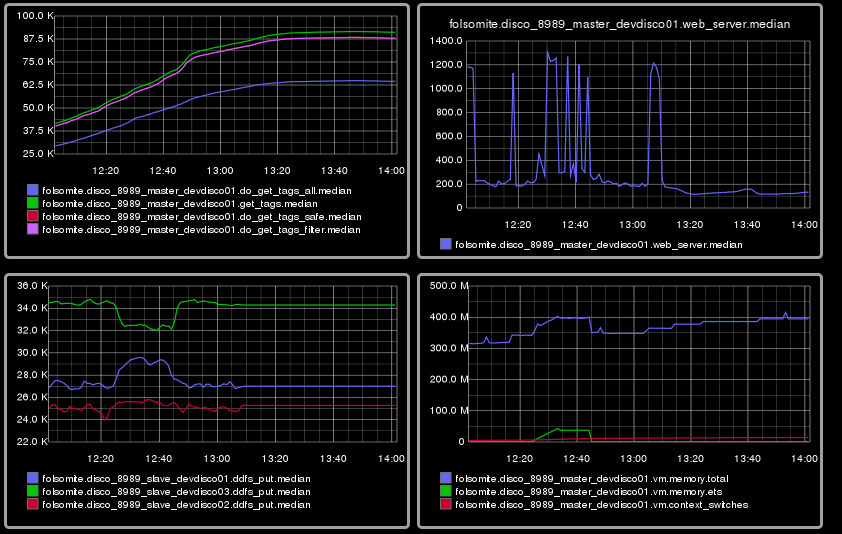
folsom Folsom let us measure the time it took to run certain functions. Folsom is most suitable for monitoring an Erlang application in production. It includes different histograms and different methods for storing decaying statistics. With folsom, we could attach an Erlang shell to a node and see the reported statistics. The more elegant mechanism would have been setting up folsom_webmachine for exposing these statistics. However, I found the webmachine too complicated and it had too many dependencies. A simpler mechanism was using folsomite for exposing these information into a grpahite server. Setting up the graphite server seemed to be a complicated task by itself, so we used hostedgraphite for the development. Although we had to make some changes to folsomite to make it work with hosted graphite. Now we are using an internal grpahite server. The following is a sample of the metrics:
eprof Eprof was definitely one of the most useful tools I tried. Using it is very easy and it gives you a useful list of the amount of time spent in different functions. The main drawback is that it does not give the backtraces so unless the hot functions are one of your own, you have to dig deeper. For Disco, all of the hot functions were Erlang library functions and eprof does not tell us why and by whom these function have been called. For disco, we use the following commands:
    eprof:start().
    eprof:start_profiling([disco_server, event_server, ddfs_master, disco_config]).
    eprof:stop_profiling().
    eprof:analyze(total).
and the output is something like:
    os:getenv/1                                              4  4.12     8  [ 2.00]
    gb_sets:balance_list_1/2                                 2  4.64     9  [ 4.50]
    gen_server:decode_msg/8                                 10  5.67    11  [ 1.10]
    erlang:send/3                                           10  6.70    13  [ 1.30]
gen_server:reply/2 3 7.73 15 [ 5.00]- fprof Fprof produced way too much information to be useful. This, as well as the slowdown of the application makes it not as useful as the other tools for the large applications like Disco.
- dbg DBG is a very interesting tool. It lets you find out when a specific function has been called without modifying that certain function and without restarting or reloading the application. The usage is not that complicated and This dynamic nature of dbg makes it very cool and can save a lot of modify-compile-run cycles. I will definitely use it more in the future.
- exometer The main reason I tried to use exometer was because of this article. Unfortunately, exometer seems to be too complicated compared to folsom and I think folsom does a good job for us in this category.
eflame Eflame is a simple tool that creates flame graphs of the function calls. It is a very nice visualization mechanism and can give us more information about where and how the CPU time is spent. The following two graphs show the time spent for processing a disco http request:

eper Redbug seems to be the most widely used. I read a good presentation about it. In disco we can use it like this:
redbug:start("ddfs_master:choose_write_nodes->stack")and it prints something like:
    17:18:15 <0.8451.0>({ddfs_tag,init,1})
            {ddfs_master,choose_write_nodes, [1,[],[]]}
                  proc_lib:init_p_do_apply/3
                  gen_server:handle_msg/5
                  ddfs_tag:handle_cast/2
                  ddfs_tag:do_put/5
                  ddfs_tag:put_distribute/1
This is very useful for debugging and understanding what is happening but it is not designed for production.
dtrace Our production and development clusters are both Linux systems and we did not have DTrace. However, we are getting a FreeBSD 10 system that will be used for running dtrace and chasing the performance issues; hopefully leading to better observability of the system. I am looking forward to using dtrace for figuring out this problem.
Percept Percept is a concurrency debugging tool shipped with erlang. There is another tool called percept2 that we used for the debugging purposes and we will describe as follows. We use the following commands for running percept2:
    percept2:profile("test.dat", [all]).
    percept2:stop_profile().
    percept2:analyze(["test.dat"]).
    percept2:start_webserver(8888).
In this sequence of commands, we set profiling info and start profiling, stop profiling, analyze the results and then start a webserver to view the results. The processing can be done in another node.
With percept2 we figured out that the concurrency level of the disco master processes is high and we did not find any bottlenecks.
The performance issue mentioned in the beginning of the post was in part because of the configuration changes introduced in Erlang R15. And we saw some improvements by disabling scheduler compaction and asking beam to pin the schedulers to the cores. Based on the results we got from the analysis of percept2, we are also looking into algorithmic improvements in the disco master. I will write about this problem and our proposed solution in a future post.